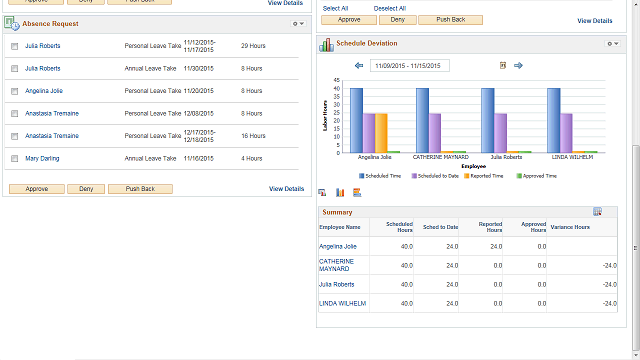

The Schedule Deviation graph is an analytical tool that shows the number of scheduled hours, scheduled hours to date, reported hours, approved hours, and the schedule deviation for your employees for the current time period.
You can click into the graph or an employee name to view their time.